Annotations & tracking
Google Analytics 4 annotations: the complete guide
Everything about GA4 annotations: what they are, the exact steps to add, edit, and delete them, who can create them, the limits, the API, best practices, and how to keep them filled automatically.
Stefan Köhn
Jun 15, 2026 · 7 min read
For years, the most common complaint about Google Analytics 4 was that it dropped a feature Universal Analytics had: annotations, the little notes you pin to a date so future-you remembers what happened. They vanished when Universal Analytics was retired in 2023, and after a long wait, Google brought them back to GA4 in March 2025, this time with color coding, future dates, and an official API for adding them programmatically.
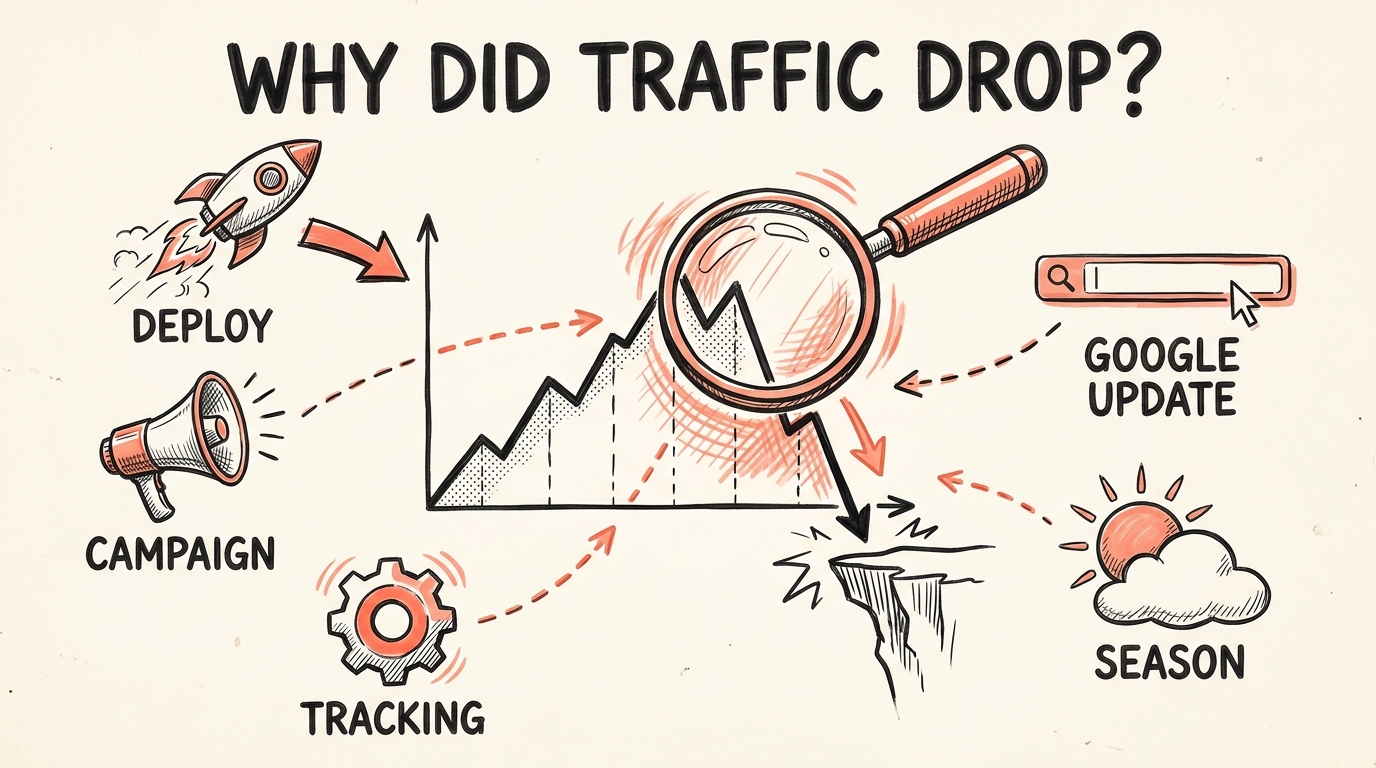
I spent a lot of years living inside analytics dashboards. Annotations were the difference between "traffic dropped on the 14th" and "traffic dropped on the 14th because we relaunched the homepage." This is the complete guide: what they are, how to add, edit, and delete them, who can create them, the limits, the API, best practices, and where they fall short once a whole team is involved.
What is a Google Analytics 4 annotation?
An annotation is a dated note attached to your Google Analytics reports. It shows up as a small marker under the line on any time-series chart, and hovering it reveals the note you wrote. The point is context: instead of staring at a dip and guessing, you (and anyone else on the property) see "homepage relaunch" or "Black Friday sale started" pinned to the exact day.
Annotations are scoped to the property, not to a single report. Add one once, and it appears across every report that shares that time-series view.
A short history: gone, then back
Universal Analytics had annotations for years. When Google retired UA in 2023, they disappeared, and GA4 launched without them, which became one of the most requested missing features. Google finally returned annotations to GA4 in March 2025, alongside a few improvements over the old version:
- Color coding, so you can categorize annotations at a glance.
- Future dates, so you can pre-plan for a scheduled launch or campaign.
- An API, so annotations can be created programmatically, not just by hand.
How to add an annotation in GA4 (step by step)
There are two ways to create one. Both need a report that has a line chart, such as Reports, then Acquisition or Engagement.
Method 1, straight from the chart:
Open a report with a line chart
In the left menu, open Reports and pick any report with a time-series chart at the top.
Right-click the day you want to mark
Right-click the data point on the line for that date and choose Add annotation.
Fill in the details and save
Enter a title, a description, the date (or a date range), and a color, then click Create annotation.
Method 2, from the annotations panel: open a report with a line chart, click the annotations icon above the chart to open the annotations panel, then click Create annotation and fill in the same fields.
Users
Last 90 daysMay 6, 2026 · Checkout v3.4 shipped
New checkout flow live in production
Create annotation
Where annotations appear
Once saved, an annotation shows up as a marker across all reports and report cards that have a line chart, not just the report you created it from. That is what makes them a property-wide layer of context rather than a note on one screen.
How to edit, delete, or export annotations
Everything lives in one place:
Open Admin
Click the Admin (gear) icon in the bottom-left corner of GA4.
Go to Annotations
Under Data display, click Annotations.
Manage them
From here you can view, edit, delete, or export every annotation on the property.
Who can create annotations
Annotations follow your GA4 property roles:
- Analyst or above can create, edit, and delete annotations.
- Viewer or above can see them.
If someone cannot add an annotation, their role is almost always the reason.
Single date or date range?
An annotation can mark a single day or span a date range (useful for a week-long sale or a phased rollout). Google's own advice: if you expect a lot of annotations with overlapping ranges, prefer single dates, because overlapping ranges get hard to read on the chart.
The limits you need to know
These are hard limits, and they shape how you name and use annotations:
- Title: 60 characters.
- Description: 150 characters.
- Per property: 1000 annotations total, counting both those added by hand and those created through the API.
Plan for them. Sixty characters goes fast, so lead the title with the specific change ("Checkout v3.4 shipped") rather than a generic prefix.
What changed versus Universal Analytics
If you remember UA annotations, here is what is different in GA4:
| Universal Analytics | GA4 annotations | |
|---|---|---|
| Availability | Retired in 2023 | Back since March 2025 |
| Color coding | No | Yes |
| Future dates | No | Yes, for planned events |
| API access | No | Yes, via the Admin API |
| Character limits | Looser | 60 title / 150 description |
| Per-property cap | Effectively unlimited | 1000 annotations |
The GA4 annotations API
The return of annotations came with something Universal Analytics never had: an API. Google exposes annotations through the Analytics Admin API as the reportingDataAnnotations resource, with methods to create, list, get, update, and delete them. Annotations no longer have to be typed in by hand, they can be written by code the moment a change happens.
Rolling your own means building and maintaining a script that handles OAuth, respects the 60/150 character limits, avoids duplicates, and manages the 1000-per-property cap. It is very doable, and it is also the kind of small integration that quietly rots unless someone owns it. So you either build it yourself, or hand it to a tool that already keeps it running (more on that below).
Best practices: what to annotate
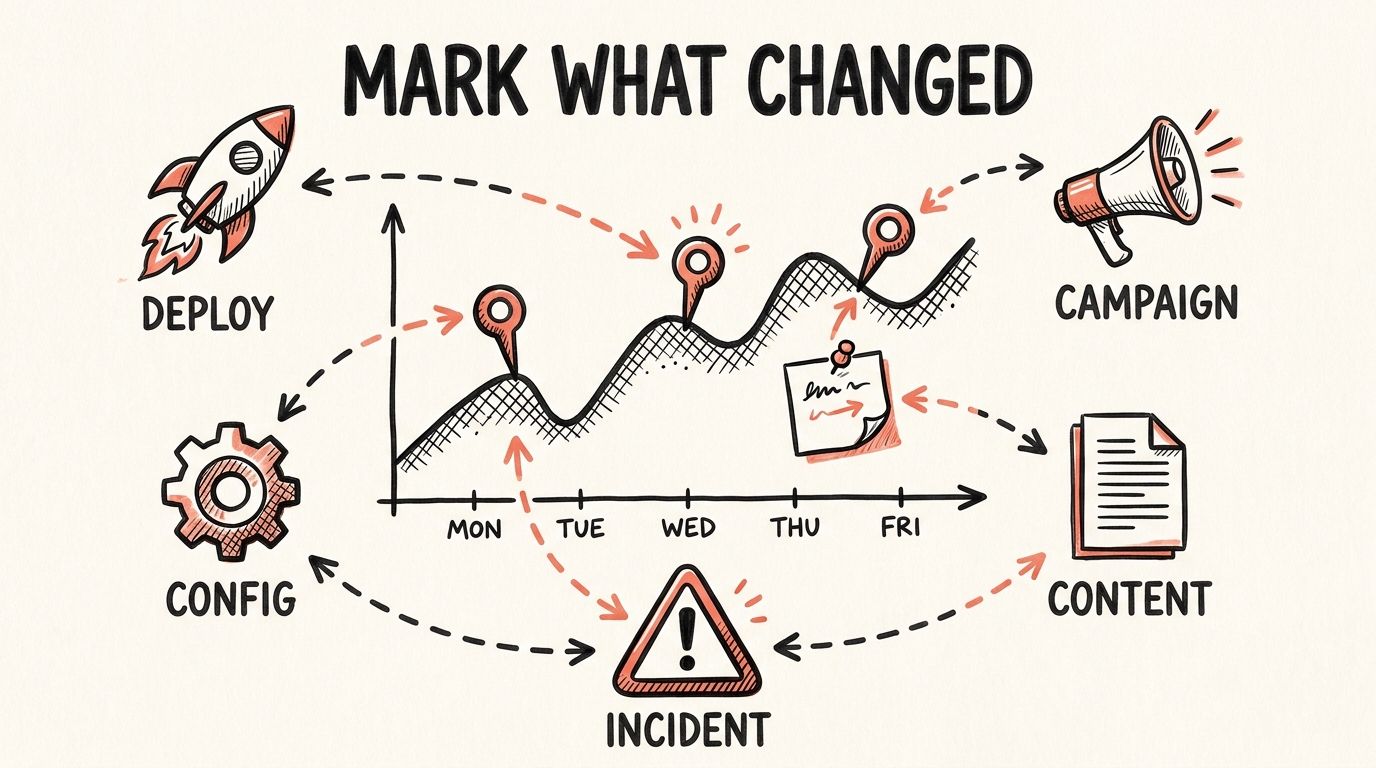
Annotations are only as useful as what you put in them. The changes worth marking are the ones that move KPIs:
- Deployments and releases, the version that shipped.
- Campaigns, launches, pauses, and budget changes (the same logic applies to Google Ads annotations).
- Tracking and tag changes in Google Tag Manager, the silent cause behind a lot of "metrics look weird" moments.
- Site and content changes, a redesign, a template change, a big publish.
- SEO events, a Google algorithm update rollout.
- Seasonality and promotions, sales, holidays, price changes.
A simple naming convention helps: put the category and the specific thing first, keep it under 60 characters, and stay consistent so you can scan the chart months later.
Where GA4 annotations fall short
Annotations are a real improvement, and you should use them. In a bigger team, though, they hit a wall, and it is almost always the same one.
Someone has to remember. An annotation only exists if a human stops, opens the chart, and types it in on the right day. In practice, IT ships a deploy and moves on, marketing launches a campaign and moves on, and nobody goes back into GA to write it down. So the annotation layer sits empty exactly when a KPI moves and you go looking for why.
Two more limits sit next to it:
- They only live inside GA. The deploy was in GitHub, the campaign in Google Ads, the tag change in Tag Manager. None of that is in GA4, so even a diligent team is copying context by hand, after the fact.
- They are easy to lose. Annotations sit behind a chart most of the company never opens. They are not a shared, searchable record everyone can read.
How to keep annotations filled automatically
The fix is to stop annotating by hand. You have two options:
- Build it on the API. Wire up the
reportingDataAnnotationsendpoint yourself and write annotations from your deploy pipeline or CI. Full control, and full maintenance. - Use a tool that does it for you. This is what CoNote does: connect a GA4 property once, and every deploy, campaign, and config change is written into it as a native annotation within minutes, no one has to remember. Your whole team sees the context on the chart, right where they already work.
That solves "someone has to remember." It does not change the fact that GA annotations only cover GA. So CoNote also keeps the same changes on one shared timeline, every tool side by side, so you get both: the context inside Google Analytics where your analysts look, and the full cross-tool picture when you need to see what else changed that week.
Google Analytics shows you the KPI moved. Annotations that stay filled tell you why.
Frequently asked questions
Are annotations back in Google Analytics 4?
Yes. Google removed annotations when Universal Analytics was shut down in 2023, and brought them back to GA4 in March 2025, this time with color coding, future dates, and an official API for adding them programmatically.
How do I add an annotation in GA4?
Open a report that has a line chart (such as Reports, then Acquisition or Engagement), then either right-click a point on the chart and choose Add annotation, or open the annotations panel from the icon above the chart and click Create annotation. Set the date, a title, a description, and a color, then save.
Who can create annotations in GA4?
You need the Analyst role or above on the property to create, edit, or delete annotations. Anyone with Viewer access or above can see them.
How many annotations can a GA4 property have?
Each property is limited to 1000 annotations, counting both those added by hand and those created through the API.
What are the character limits for a GA4 annotation?
The title is limited to 60 characters and the description to 150 characters.
Can I add GA4 annotations automatically or through an API?
Yes. The Google Analytics Admin API exposes annotations as the reportingDataAnnotations resource, so you can create them with code. If you would rather not build and maintain that yourself, a tool like CoNote connects once and writes your deploys, campaigns, and config changes into the property as annotations automatically.
Can a GA4 annotation cover a date range?
Yes. An annotation can mark a single date or a date range. Google recommends single dates when you expect many overlapping annotations, to keep the chart readable.
Can I edit or delete a GA4 annotation?
Yes. In the Admin area, under Data display, open Annotations to view, edit, delete, or export every annotation on the property. Annotations that Google generates automatically cannot be edited or deleted.
Why can’t I see annotations in GA4?
Annotations only appear on reports that have a line chart, and only for users with Viewer access or above. If the report has no time-series chart, or annotation display is turned off in the annotations panel, you will not see them.
Written by
Stefan Köhn
Founder of CoNote
Stefan has spent twenty years running performance marketing and SEO, both in-house and as a consultant. He has answered the question “why did the KPIs move?” more times than he can count, usually the hard way. CoNote is the tool he wished he had every one of those times.