Diagnosing change
Why did my organic traffic drop? A step-by-step diagnosis
Organic traffic fell and nobody knows why. Work this exact order, from tracking bugs and AI Overviews to core updates, to find the real cause instead of guessing.
Stefan Köhn
Jun 15, 2026 · Updated Jun 29, 2026 · 13 min read
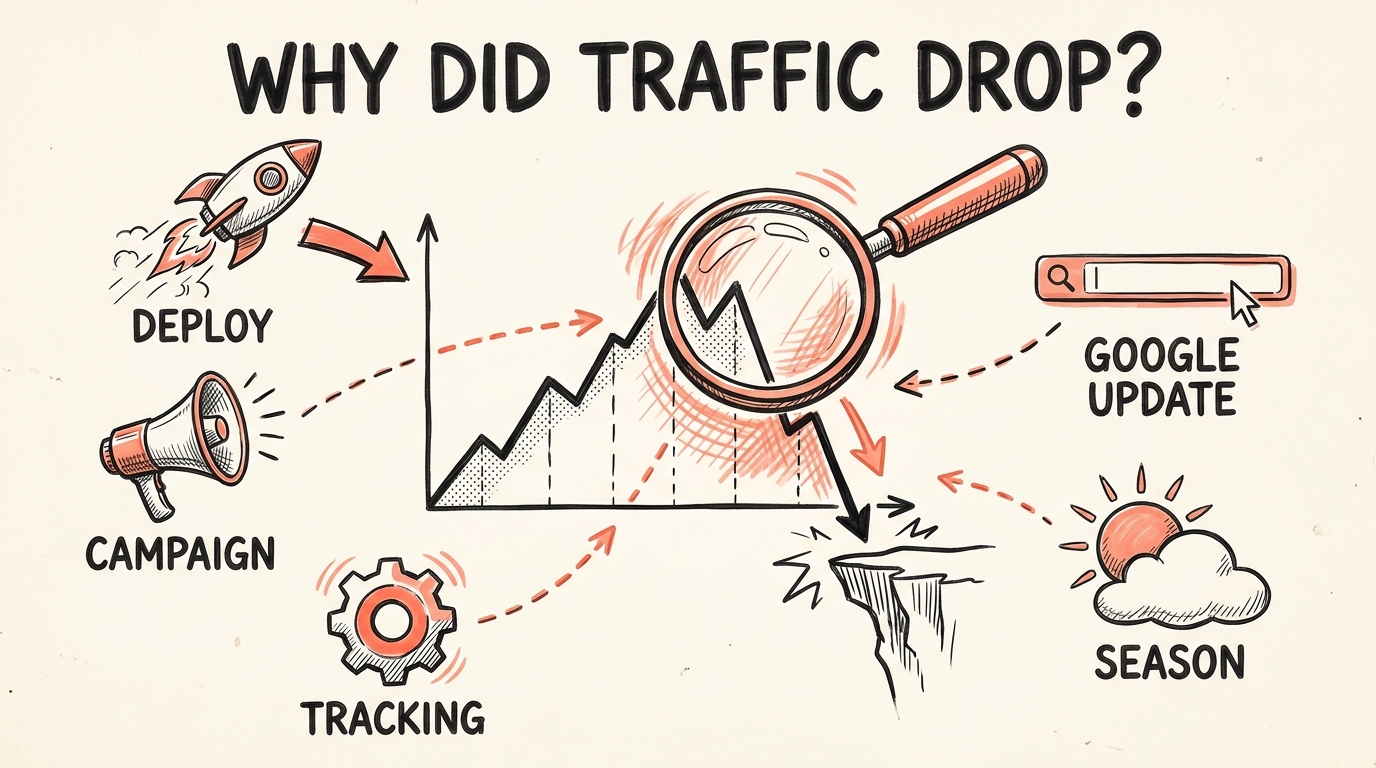
Your organic traffic is down. The dashboard is red, someone important has noticed, and the question lands on your desk: what happened?
I have been on the receiving end of that question for twenty years, across in-house teams and consulting work. The instinct is to start guessing, "maybe it's a Google update?", "maybe the new release broke something?". Guessing is slow and it is usually wrong. There is a better order to work through, and it starts with the least glamorous suspect.
This guide is that order. Work it top to bottom and you will land on the real cause instead of the loudest theory in the room. It holds whether your traffic fell off a cliff overnight or quietly bled away over weeks, and whether the culprit is your own code or the search results changing shape underneath you. That second case, where your rankings never moved but the clicks vanished anyway, has become the most common drop of all in 2026, and this guide will tell you when you are looking at it.
One note before the steps. The slow part of a drop is rarely the analysis, it is reconstructing what changed and when. A shared company logbook fixes that for good: every deploy, campaign, and config change on one timeline, so the date of the drop already sits beside its cause. That is what CoNote does, and I will come back to it. For today, here is how to find the cause by hand.
The 60-second triage
Before you open a single report, narrow the field. Three quick questions move you from "everything is on fire" to "I know which fire":
- Is it just organic, or everything? If paid and direct dropped on the same day too, suspect tracking, not SEO. (Not sure the loss is organic yet? Start one level up, with how to find out why traffic dropped, then come back here.)
- Cliff or slope? A sudden overnight drop and a slow bleed have completely different cause lists.
- One page or the whole site? Almost every real drop is concentrated in a handful of URLs. Sitewide and uniform points back to measurement.
Now work the steps properly.
Step 1: Make sure the drop is real
Before you debug the site, debug the measurement. A surprising share of "traffic drops" never happened. The traffic was fine, the tracking broke.
Check, in this order:
- Did the GA4 tag stop firing? A new consent banner, a Google Tag Manager publish, or a deployment that removed the snippet will all flatline your numbers while real users keep visiting.
- Is the drop suspiciously clean? Real traffic declines are messy. A measurement break is often a perfect cliff: full volume one day, near zero the next, across every page at once.
- Does one channel hold steady? If direct and paid look normal but organic cratered, that points to a real organic problem. If everything dropped together on the same day, look at tracking first.
- Did the sessions move channel, not vanish? Visits from ChatGPT, Perplexity, and Google's AI Mode usually land in GA4's Direct or Referral buckets, not Organic, because the analytics has no AI category by default. A dip in Organic with a matching bump in Direct or Referral can mean people are arriving from AI answers, not that traffic left. Set up a custom channel group with a regex filter for the known AI hosts and the picture sharpens.
The fastest tracking check there is: compare GA4 to Google Search Console. GSC measures clicks from Google's own side and does not depend on your tag. If GSC clicks are steady but GA4 sessions cratered, your traffic is fine and your tracking is broken. If both fell together, the drop is real.
If the numbers are genuinely down, move on. If they are not, you just saved yourself a week.
Step 2: Pin the exact date
Find the day the line bent. Not the week, the day. Almost every real cause leaves a date stamp, and the date is what lets you match the drop to a cause.
Open the GSC Performance report
Search results, last 3 or 6 months, so the bend is obvious against the trend.
Switch to Compare
Use the date picker to compare the weeks around the drop, not month-over-month totals that blur the edge.
Read the shape, then write down the exact date
You will use this date in every step that follows. It is the single most useful fact in the whole investigation.
Then classify the shape:
- A cliff (sudden, overnight) usually means something changed: a deployment, a tracking break, a manual action, a botched migration.
- A slope (gradual decline over weeks) usually means competition, decaying content, slow indexing loss, or seasonality.
- A step down that holds often lines up with a Google algorithm update.
The shape tells you which list to work through next.
Step 3: Triangulate clicks, impressions, and position
This is the step most people skip, and it is the one that turns a week of guessing into an afternoon. In the GSC Performance report, turn on all three metrics: clicks, impressions, and average position. Which one moved tells you what kind of problem you have.
| What moved in Search Console | What it usually means | Where to look next |
|---|---|---|
| Position dropped | You lost rankings | Algorithm update, a competitor, lost links, or an on-page change |
| Impressions dropped, position held | Fewer searches, or you lost SERP real estate | Seasonality, falling demand, or a new SERP feature on your queries |
| Clicks dropped, impressions and position held | People see you but click less | AI Overviews, more ads, or a featured snippet answering the query |
| Everything dropped on the same clean day | Likely not an SEO problem at all | Tracking break, deindexing, or a server outage |
A clicks-only drop is the one teams misdiagnose most often, and in 2026 it is also the most common. Your rankings hold, your impressions hold, but clicks fall anyway. SEOs call this the Great Decoupling: an AI Overview, a featured snippet, or a People Also Ask box now answers the query at the top of the page, so people get what they came for without clicking through. No deploy broke anything. The SERP changed shape underneath you.
The numbers are stark. In Seer Interactive's 2025 analysis, organic click-through rate fell from 1.76% to 0.61% when an AI Overview appeared on the query, a drop of roughly 61%, even for results that kept position one. Around 60% of Google searches now end with no click at all, and on mobile it is closer to 77%. So before you tear apart your own site, settle one question: did you actually lose rankings, or did you only lose the click?
The tell for an AI Overview problem is divergence. In the GSC Performance report, watch impressions and clicks as separate lines. If impressions are flat or rising while clicks fall, an AI feature is intercepting the click before people reach you. Confirm it in thirty seconds: search your top queries yourself and look at what sits above the first blue link.
Step 4: Segment the drop
A drop is almost never evenly spread. Where it concentrates names the cause. In GSC, slice the same date comparison by:
- Page. One template or section tanking points at a code or content change to that template. The whole site points at something global (algorithm, robots, tracking).
- Query, brand vs non-brand. Brand searches steady but non-brand gone means an SEO or ranking problem. Brand down too usually means a PR, demand, or outage issue, not SEO.
- Country. A single market dropping points at hreflang, a local competitor, or a regional SERP change.
- Device. Mobile-only drops point at a mobile rendering, layout, or Core Web Vitals regression.
Spend five minutes here and you usually walk away already knowing the answer.
Step 5: Work the usual suspects, in order
Now match your date, shape, and segment against the cause list, cheapest to check first.
Technical and deployment changes
The most common cause of an overnight cliff is something your own team shipped.
- A
noindextag or arobots.txtrule that went out with a release - A site migration, URL structure change, or redirects that broke
- A template change that stripped internal links, titles, or structured data
- A performance regression that tanked Core Web Vitals
Ask the obvious question: what did we deploy around that date? This is where most drops are solved, and also where most teams waste days, because nobody can remember what shipped when.
Indexing and coverage loss
If pages quietly fell out of Google's index, they cannot rank. Open the GSC Pages (indexing) report and compare indexed counts around your date. A jump in "Crawled, not indexed" or "Discovered, not indexed", or pages flipping to "Excluded by noindex tag", is a smoking gun, usually caused by a release or a CMS change.
Manual actions and security issues
Rare, but devastating, and free to rule out. Check the Manual Actions and Security Issues reports in GSC. A manual action is a human penalty from Google's webspam team. A security issue (hacked content, malware) can deindex you fast. Both show up here and nowhere else.
Server errors and downtime
If your server returned 5xx errors or crawled painfully slowly around the date, Googlebot may have backed off and dropped pages. Check uptime logs and the GSC Crawl stats report for a spike in errors or response time.
Google algorithm updates
If the drop is a step that holds and you ruled out your own changes, check whether Google ran a core or spam update around that date. Google publishes confirmed updates on its Search Status Dashboard. Match the date. If your drop starts on the day a core update finished rolling out, you have your answer, and a different project ahead of you.
Lost rankings, SERP changes, and CTR loss
Even with no algorithm update and no deploy, you can lose traffic to:
- A competitor who overtook you on a high-volume keyword
- An AI Overview or AI Mode answer that resolves the query at the top of the page, so impressions hold but clicks fall (the Great Decoupling from Step 3)
- A featured snippet or People Also Ask box absorbing the click before anyone scrolls
- Search moving off Google entirely: more research now happens inside ChatGPT, Perplexity, and Gemini, where your page may be read or cited without ever sending a visit
- More ads or SERP features pushing you below the fold
- Lost backlinks that were propping up a key page
- Keyword cannibalisation: a new page you published competing with an old one for the same query, so both rank worse
Seasonality and the outside world
Some drops are not your fault and not a problem. Compare year over year, not just month over month. A travel site in January and a tax tool in May move for reasons no deploy log will explain. Weather, holidays, and news cycles all count.
Step 6: Cross-reference, do not guess
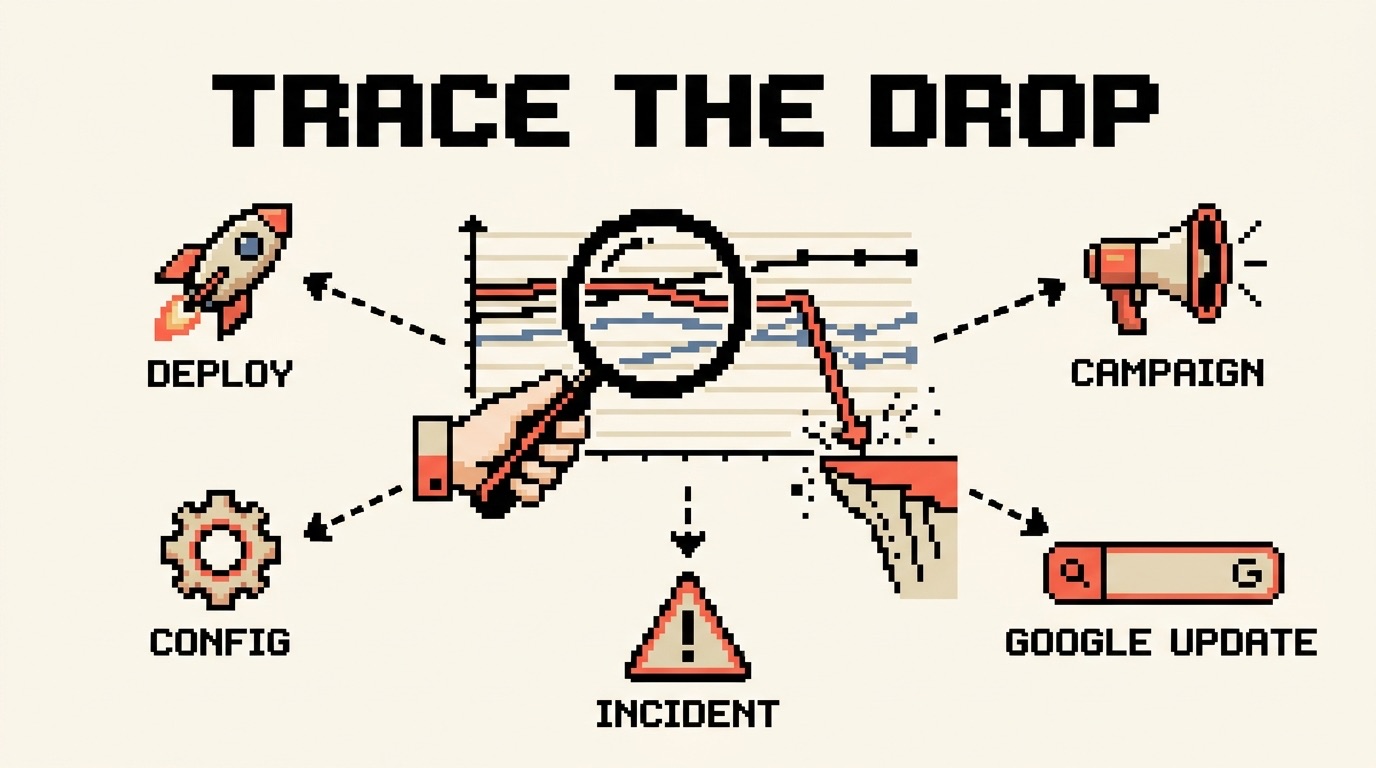
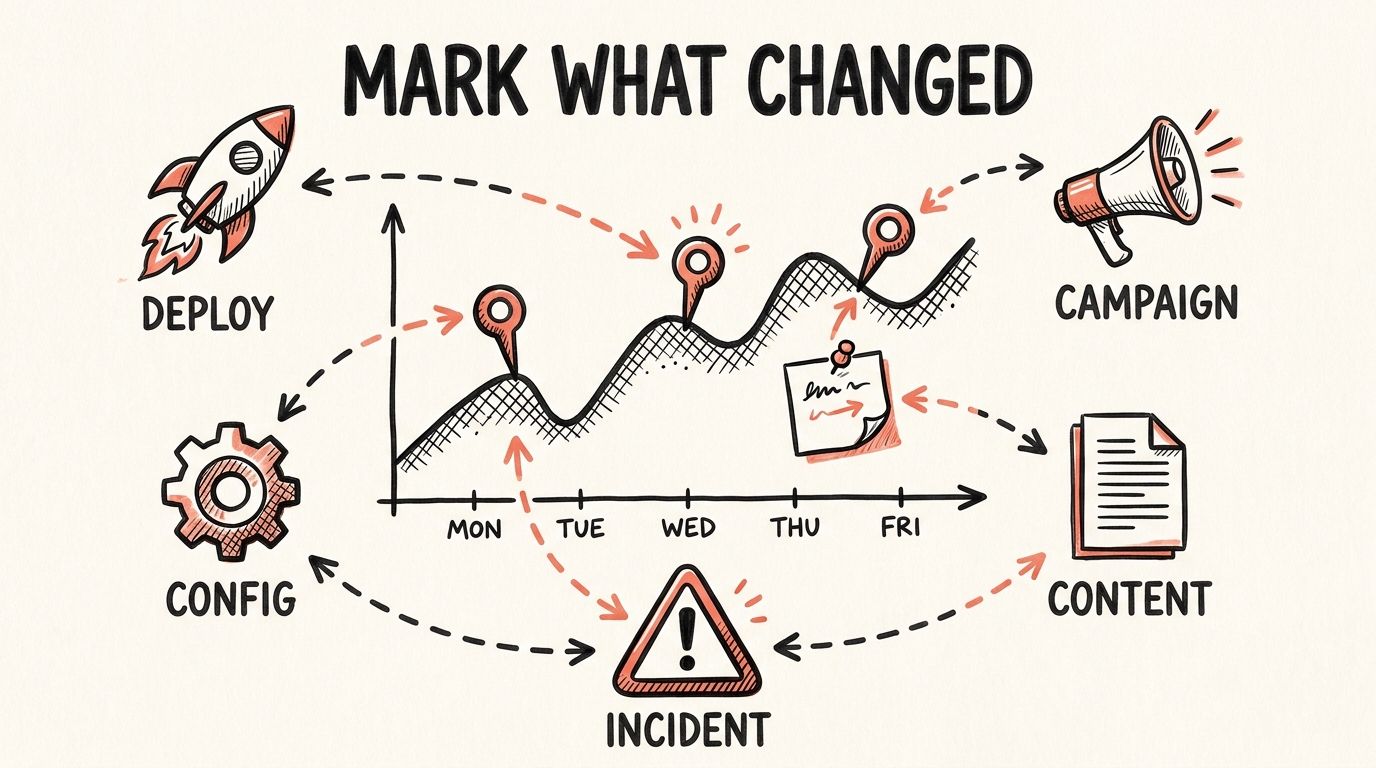
Here is the pattern behind every fast diagnosis I have ever done: put the drop date next to a list of everything that changed around it. The deploys, the GTM publishes, the campaign launches, the algorithm updates, side by side on one date. The cause is almost always sitting right there. The slow part was never the analysis. It was reconstructing what happened, weeks later, from memory and Slack scrollback.
| Symptom | Most likely cause | How to confirm | Typical recovery |
|---|---|---|---|
| Clean overnight cliff, all pages | Tracking break or accidental noindex | GSC indexing report, view page source for robots tags | Hours, once the tag is fixed and recrawled |
| Cliff on one template or section | A deploy to that template | Match the date to your release log | Days to weeks after redeploy and recrawl |
| Step down that holds, sitewide | Core algorithm update | Google Search Status Dashboard | Weeks to months, often next update |
| Slow slope over weeks | Competition, decay, or lost links | Rank tracking on top pages | Weeks of content and link work |
| Clicks down, rankings fine | AI Overview or SERP layout | Inspect the live SERP for your queries | Structural, adapt rather than recover |
This is exactly the gap CoNote closes. It keeps an automatic, shared timeline of what changed across your stack, deploys, tag manager versions, campaigns, config changes, so when traffic moves you open one page, find the date, and read the reason. Know why the KPIs moved, without the archaeology.
How long until it recovers?
Recovery time depends entirely on the cause, which is why diagnosis matters more than panic:
- Tracking break or accidental noindex: hours to days, once fixed and recrawled. The traffic was never really gone.
- Broken deploy or migration: days to a few weeks after you ship the fix and Google recrawls.
- Algorithm update: weeks to months, and often only at the next update, after you genuinely improve the affected pages.
- Lost rankings to competitors or decay: weeks of sustained content and link work. There is no switch to flip.
- CTR loss to AI Overviews and AI search: treat it as structural. The clicks are not coming back to the old SERP, so adapt rather than wait it out. Target queries an AI answer cannot fully resolve, and aim to be the source cited inside the AI answer instead of the blue link below it.
Frequently asked questions
How do I know if it's a Google update or something I did? Check the shape and the date. A step down that holds and lines up with a confirmed update on Google's Search Status Dashboard points to the algorithm. A clean cliff that matches your own release log points to you. When both are candidates, your own changes are far more common, so rule those out first.
Is a traffic drop the same as a penalty? No. Penalties (manual actions) are rare and show up in the GSC Manual Actions report. The vast majority of drops are algorithm updates, technical mistakes, lost rankings, or seasonality, none of which are penalties.
Can organic traffic recover on its own? Sometimes. A tracking break or a seasonal dip recovers once the cause passes. A drop from an algorithm update or lost rankings will not fix itself: it needs the underlying issue addressed.
My rankings look fine but traffic still fell. What gives? This is the Great Decoupling, and in 2026 it is the single most common drop. You still rank, but an AI Overview, a featured snippet, or more ads now absorb the click before anyone reaches you. In one 2025 analysis an AI Overview cut organic click-through rate by about 61%, even for results holding position one. Search your top queries yourself to see what sits above the first blue link.
Is ChatGPT or AI search stealing my traffic? Increasingly, yes, in two ways. AI Overviews answer the query on Google so the click never happens, and more research now starts inside ChatGPT, Perplexity, or Gemini instead of a search box. Check GA4 carefully: referrals from those tools usually hide in your Direct and Referral channels rather than Organic, so a custom channel group is the only way to size the shift honestly.
How far back should I compare? Compare year over year to separate seasonality from a real problem, and week over week around the exact date to find the precise bend. Month over month alone hides both.
The one habit that makes the next drop a five-minute fix
Every diagnosis in this guide hinges on one thing: knowing what changed and when. Teams that keep that record solve drops in minutes. Teams that do not spend days reconstructing it. Keep a running log of deploys, releases, tag changes, and campaigns, and the next time a KPI moves, the answer is already logged.
Written by
Stefan Köhn
Founder of CoNote
Stefan has spent twenty years running performance marketing and SEO, both in-house and as a consultant. He has answered the question “why did the KPIs move?” more times than he can count, usually the hard way. CoNote is the tool he wished he had every one of those times.