Diagnosing change
Why did my traffic drop? How to find out what happened
Your traffic fell and the cause is not obvious. Investigate it layer by layer in your analytics, from channel to page to device to date, and find what actually changed.
Stefan Köhn
Jun 29, 2026 · Updated Jun 29, 2026 · 12 min read
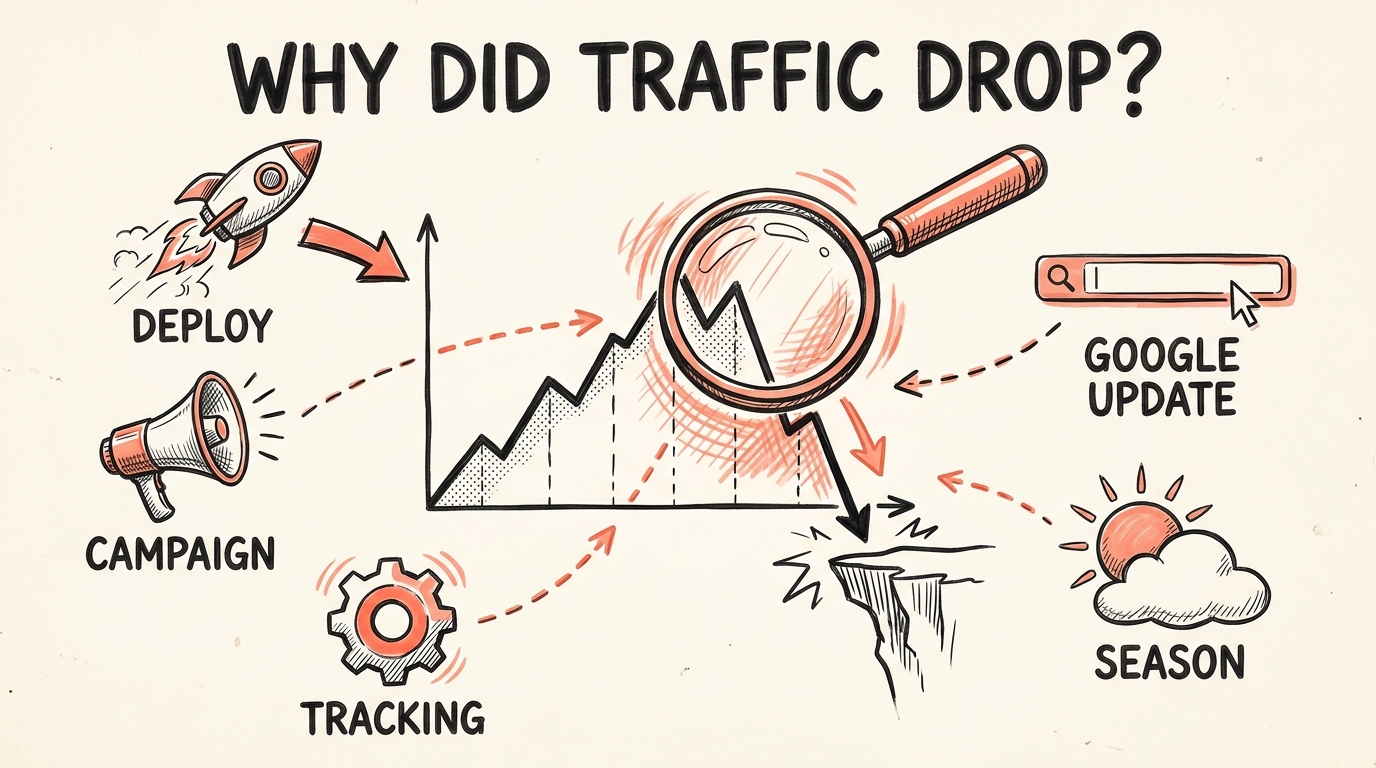
A traffic number on a dashboard is a headline, not an explanation. It tells you something moved. It does not tell you what, where, or why. So when the line drops and the question lands on your desk, the temptation is to answer the headline directly: it must be a Google update, or the new release broke something. That is theorising before investigating, and it is how teams lose a week chasing the loudest guess in the room.
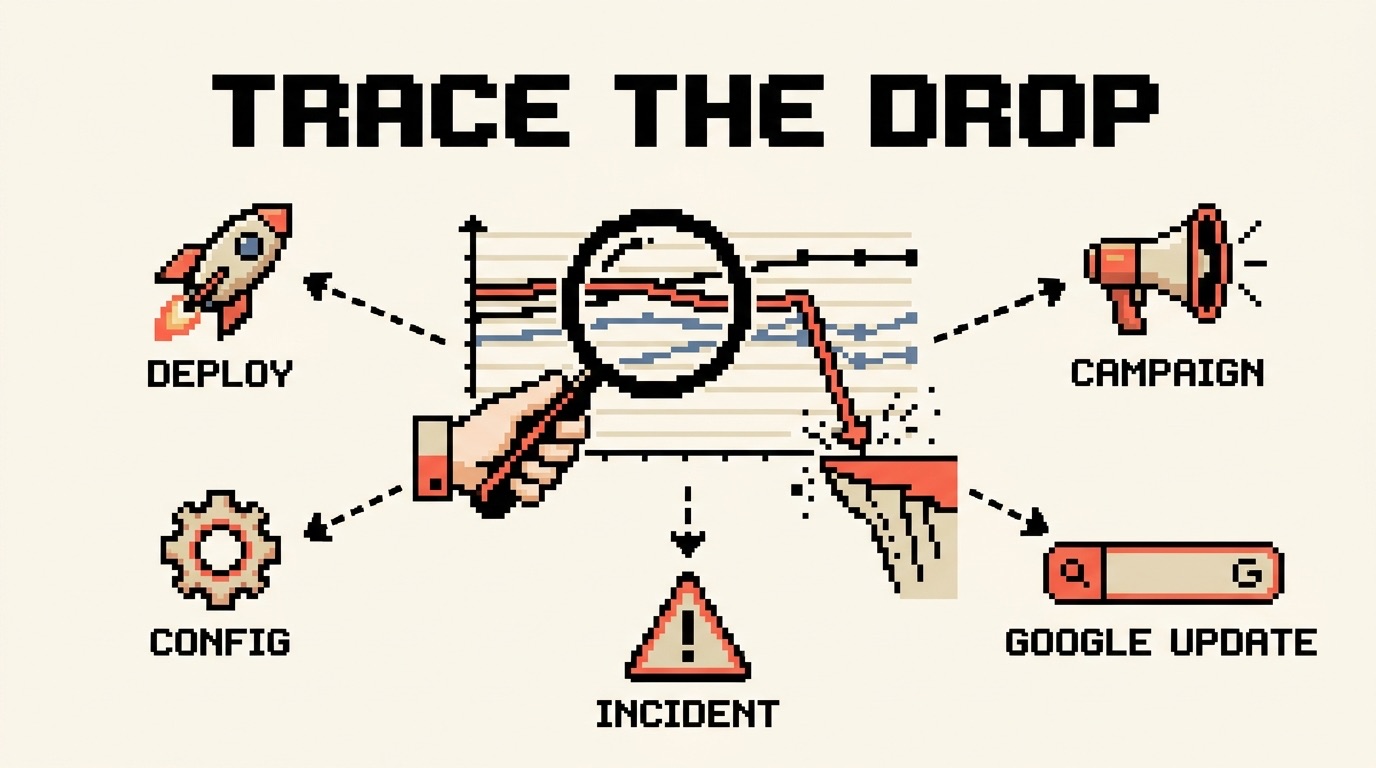
I have spent twenty years on the other end of that question, in-house and as a consultant. The fastest diagnoses I have ever made had nothing to do with being clever about causes. They came from being disciplined about investigation: taking the one big scary number apart, layer by layer, until the drop had a name. A named drop almost always names its own cause.
This is that method. It works for any traffic, organic, paid, direct, referral, email, or social, because the first half of the job is identical no matter what fell. You narrow until you know exactly which slice moved. Then you switch to the cause list for that slice, and the deepest of those have their own detailed guide linked from here.
There is a lasting fix for the reconstruction part, and it is structural: one shared company logbook where every change across the company, every deploy, campaign, and config edit, is recorded on a single timeline, so the next time a number moves the cause is already sitting next to the date. That is what CoNote does, and I will come back to it at the end. This guide is for the times you have to find the cause by hand, today.
The principle: a drop is never evenly spread
Total traffic is a sum, and a sum hides everything useful. A real decline almost never spreads itself evenly across every channel, page, device, and country at once. It concentrates. One channel, one template, one market, one device. That concentration is not a detail to smooth over, it is the answer wearing a disguise. Find where the drop actually lives and you have usually found the cause, because only a handful of things can make precisely that slice fall.
So every step below has the same goal: stop staring at the total. Split it, find the slice that moved, and set the rest aside.
Step 1: Rule out a measurement break first
Before you investigate the site, investigate the numbers. A real share of traffic drops never happened at all. The visitors kept arriving and the tracking quietly stopped counting them.
Three checks, in order:
- Did tagging break? A new consent banner, a Google Tag Manager publish, or a deploy that dropped the analytics snippet will flatten your numbers while real users carry on as normal. A measurement break is often suspiciously clean: full volume one day, near zero the next, across everything at once.
- Does an independent source agree? Compare your analytics against something that does not depend on your tag. For search, Google Search Console counts clicks from Google's own side. For the whole site, your server or CDN logs count every request. If the independent source holds steady while analytics cratered, your traffic is fine and your tracking is not.
- Did the traffic move channel instead of leaving? Visits from ChatGPT, Perplexity, and Google's AI Mode usually land in Direct or Referral, not Organic, because GA4 has no AI category by default. A fall in one channel with a matching rise in another is often recategorisation, not loss.
The single fastest check is an independent source. Search Console for organic, server or CDN logs for everything else. They count traffic without touching your analytics tag, so if they hold while analytics falls, you are looking at a tracking break rather than a real loss. That one comparison saves more wasted days than any other step on this page.
Step 2: Pin the exact day the line bent
Find the day, not the week. Almost every real cause leaves a date stamp, and that date is the single most useful fact in the whole investigation, because it is what you match every later finding against.
Open your trend over 90 days
In GA4, open Reports, then Acquisition, then Traffic acquisition, and set the range to the last 90 days so the bend stands out against the trend instead of hiding inside a monthly average.
Compare, do not eyeball totals
Turn on a comparison against the previous period. Comparisons expose the edge of the drop. Month-over-month totals blur it into a soft decline that points nowhere.
Write the date down, and note the shape
You will reuse this date in every step that follows. Note whether the line is a sharp cliff or a slow slope. The two have completely different cause lists.
The shape narrows things before you have looked at a single segment:
- A cliff (sudden, overnight) means something changed on a specific day: a deploy, a tracking break, a paused campaign, a botched migration.
- A slope (a gradual decline over weeks) means competition, content decay, list fatigue, slow indexing loss, or seasonality.
- A step down that holds usually lines up with an external change you did not make, such as a Google core update for organic or a feed change for paid.
Step 3: Which channel dropped? This is the cut that decides everything
This is the most important split, and it is exactly the one an organic-only investigation skips. In GA4, open Reports, then Acquisition, then Traffic acquisition, and group by Session default channel group. Drop your date into the comparison, and read which channel actually fell.
It matters this much because every channel past this point has a different cause list and a different place to look. Naming the channel turns a vague "traffic is down" into a specific, far shorter investigation.
| Channel that dropped | What it usually points to | Where to look next |
|---|---|---|
| Organic search | Rankings, indexing, AI Overviews, a core update, or a tracking break | The organic traffic deep dive below |
| Paid search or social | Budget changes, paused campaigns, disapproved ads, or a billing issue | The ad platform change history and billing |
| Direct | A tracking break, lost UTM tags, or a client stripping referrers | Your analytics setup and recent deploys |
| Referral | A linking site removed the link, or a partner changed a redirect | Your top referrers, compared across the date |
| Deliverability, a smaller or fatigued list, or a missed send | The email platform send and deliverability reports | |
| Organic social | A platform algorithm change, or less posting from you | The platform native analytics |
| Everything at once, one clean day | Almost never a marketing problem | Tracking, an outage, or accidental deindexing |
Two patterns are worth calling out. If one channel fell while the rest held, you have your fork: go straight to that channel's cause list. If every channel fell together on the same clean day, stop investigating marketing and go back to Step 1, because that shape is measurement, an outage, or an accidental sitewide deindex, not six unrelated problems landing on one date.
Step 4: Which page or section moved?
A drop rarely spreads evenly across your pages either. In GA4, open Reports, then Engagement, then Pages and screens, compare the same date range, and sort by the largest absolute fall rather than the largest percentage, so a busy page losing real volume rises to the top. For organic specifically, the Search Console Pages report does the same from Google's side.
What the shape tells you:
- One template or section tanking points at a change shipped to that template: a code release, a redesign, a removed block of internal links, a new layout.
- A single high-value page falling points at that page alone: a competitor overtook it, someone edited it, a redirect broke, or it dropped out of the index.
- The whole site falling uniformly points back up a level to something global: measurement, a sitewide tag, a robots rule, or a core update.
Step 5: Which device, country, and audience?
The remaining layers are quick, and each one rules out a whole family of causes.
Device. Split by device category (GA4, then Tech, then Tech details). A mobile-only drop points at a mobile rendering, layout, or Core Web Vitals regression, or simply a search result that looks different on a phone. Desktop holding while mobile falls is a strong, specific signal that saves a great deal of guessing.
Country. Split by country (GA4 Demographics, or filter Search Console by country). One market falling while the others hold points at hreflang, a regional competitor, a local search change, or a translation or CDN problem in that region. A flat, global fall does not.
Audience. Two splits earn their place here. New versus returning separates an acquisition problem from a retention one. And for organic, brand versus non-brand queries in Search Console is decisive: brand steady but non-brand gone is a ranking problem, while brand falling too usually means a PR, demand, or outage issue rather than SEO.
| Layer | Where to look in GA4 or Search Console | What a concentrated drop means |
|---|---|---|
| Channel | GA4: Acquisition, Traffic acquisition | One channel names the cause; many at once means measurement |
| Page or section | GA4: Engagement, Pages and screens; GSC: Pages | One template points to a change shipped to it |
| Device | GA4: Tech, Tech details | Mobile only points to rendering, layout, or Core Web Vitals |
| Country | GA4: Demographics, Country; GSC: country filter | One market points to hreflang or a regional change |
| Audience | GA4: Explorations; new vs returning, brand vs non-brand | Brand steady but non-brand gone points to SEO |
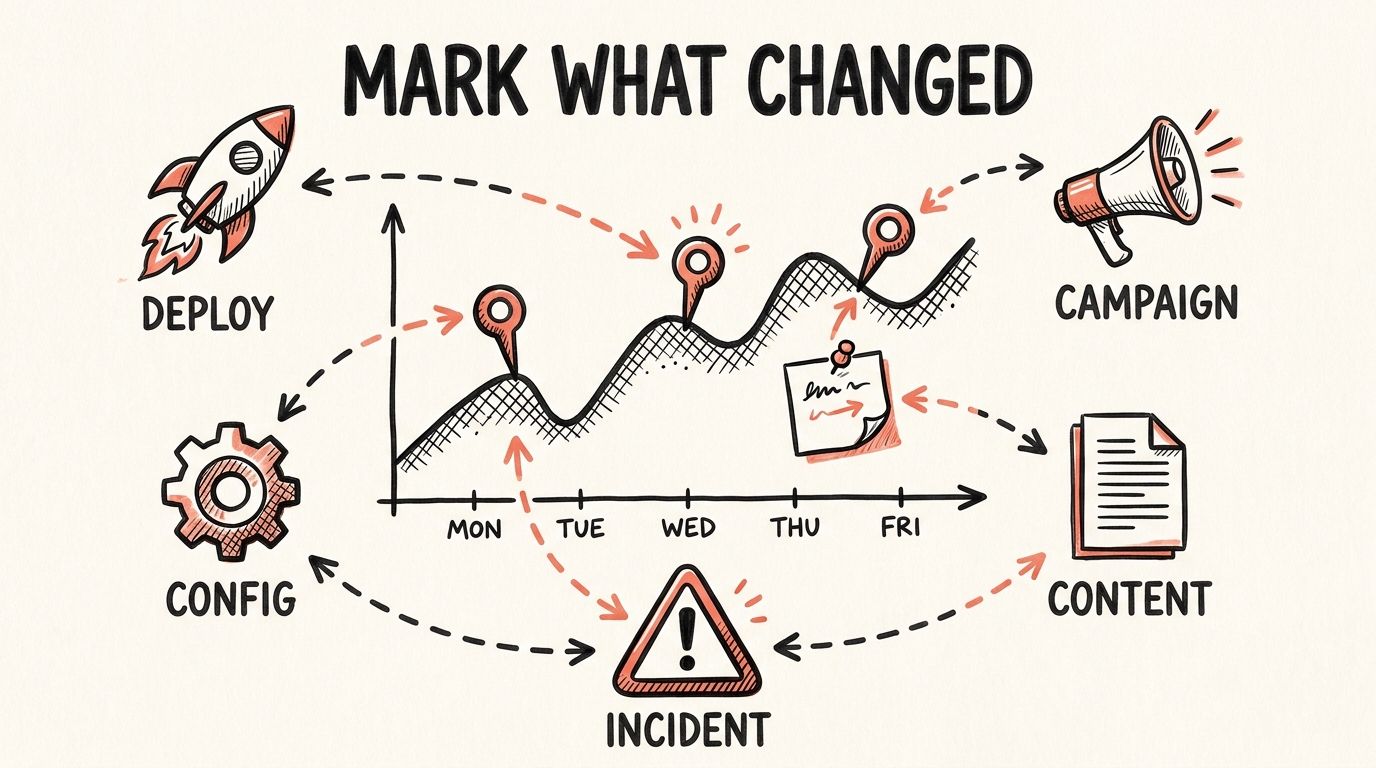
Step 6: Line the date up against everything that changed
Here is the move behind every fast diagnosis I have made. Once you know the slice that moved (the channel, the page, the device, the country) and the exact date it moved, you put that date next to a list of everything that changed around it. The deploys, the tag manager publishes, the campaign starts and pauses, the config changes, the algorithm updates, all side by side on one timeline. The cause is almost always sitting right there on the date.
The analysis was never the slow part. Reconstructing what happened was. Weeks later, working from memory, Slack scrollback, and three separate dashboards, nobody on the team can say with confidence what shipped on the day the line bent. That reconstruction is where the days disappear.
Now go deep: match the channel to its diagnosis
You have the slice and the date. Switch from investigation to diagnosis, using the cause list for the channel that actually fell:
- Organic search. Why did my organic traffic drop walks the full search cause tree: rankings, indexing, AI Overviews, core updates, and the technical changes your own team shipped.
- Paid search or paid social. Start inside the ad platform, not analytics. Its change history, billing status, and disapproval notices name the cause faster than any session report: a paused campaign, an exhausted budget, a rejected ad, or a card that failed.
- Direct. Treat a direct-only drop as a measurement story until proven otherwise. Check for lost UTM tags on a campaign, a referrer being stripped, or recategorisation into another channel.
- Referral. Open your top referrers and compare them across the date. A single source vanishing means a link was removed or a redirect changed on a site you do not control.
- Email and social. Both live in their own platforms. For email, read deliverability and send volume around the date. For social, check the platform analytics and your own posting cadence before blaming an algorithm.
How long until it recovers?
Recovery time is set by the cause, not the size of the drop, which is exactly why naming the cause matters more than reacting to the number:
- A tracking break or recategorisation. Nothing to recover. The traffic never left. Fix the measurement and the line corrects itself.
- A change you shipped (a broken deploy, a paused campaign, an accidental noindex). Hours to a few weeks, once you ship the fix and the platform catches up.
- An external shift (a core update, a platform algorithm change, AI Overviews absorbing the click). Weeks to months, and only after you genuinely adapt. There is no switch to flip.
- Slow decay or rising competition. Weeks of sustained content and link work, with no shortcut.
Frequently asked questions
Where do I even start if everything looks down? Step 1, every time. Confirm the drop is real by comparing against an independent source, then split by channel. A clean, sitewide, single-day fall is almost always measurement or an outage, not a real loss across every channel at once.
My traffic fell but my rankings are unchanged. What gives? Two common explanations. Either the visits moved channel (AI referrals landing in Direct instead of Organic), or, for organic specifically, the search results changed shape and an AI Overview or snippet now answers the query without a click. The organic traffic guide covers that second case in detail.
How far back should I compare? Two ranges, for two questions. Year over year separates seasonality from a real problem. Week over week, tight around the date you pinned, finds the precise bend. Month over month on its own hides both.
Could it just be seasonality? Possibly, and it is cheap to test. Compare the same period last year. If the shape repeats annually, you are looking at a seasonal pattern, not a problem to fix. A travel site in January and a tax tool in May move for reasons no change log will explain.
Everything dropped on the same day. Is that a penalty? Almost certainly not. Penalties are rare and channel-specific. A uniform, single-day fall across every channel is the signature of a tracking break, a server outage, or an accidental deindex, none of which are penalties.
The habit that turns the next drop into a five-minute job
Every step on this page depends on one thing: knowing what changed, and when. Teams that keep that record close a drop in minutes, because the date already sits next to a list of suspects. Teams that do not spend days rebuilding it from memory before the real work even starts. Keep a running log of your deploys, releases, tag changes, campaigns, and config edits, and the next time a number moves, the answer is already written down.
Written by
Stefan Köhn
Founder of CoNote
Stefan has spent twenty years running performance marketing and SEO, both in-house and as a consultant. He has answered the question “why did the numbers move?” more times than he can count, usually the hard way. CoNote is the tool he wished he had every one of those times.