Method & process
What should a company track to explain KPI changes fast?
When a KPI moves, the answer is scattered across ten tools and four memories. Here is the checklist of changes, internal and external, to log so you can always explain the move.
Stefan Köhn
Jul 15, 2026 · Updated Jul 15, 2026 · 15 min read
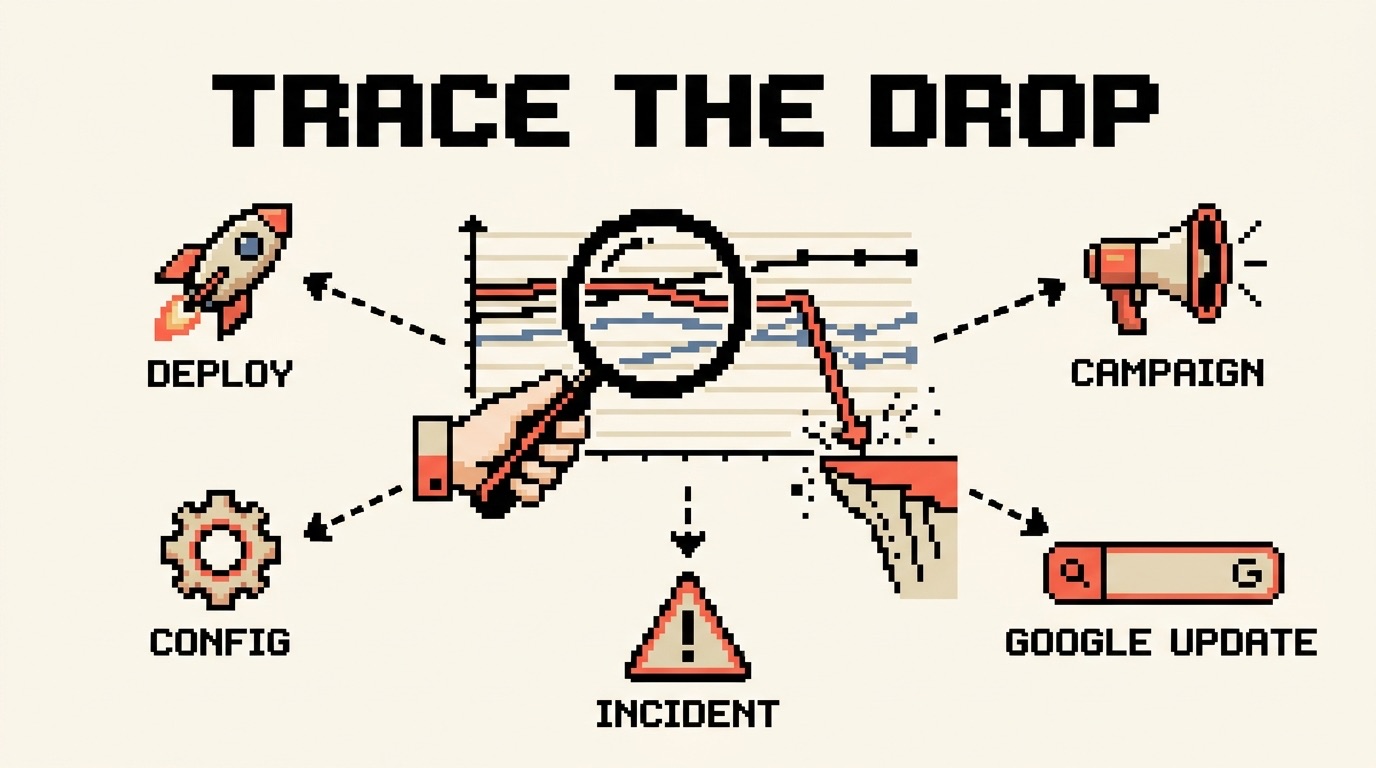
When a KPI moves, the hard part is never noticing. Your dashboard already told you the number went up or down. The question that actually costs you time is the next one: what did we change, and what happened around us, on that date? Most teams cannot answer it. Not because the answer is missing, but because it is spread across ten different tools and four people's memories, and by the time anyone goes looking, nobody can say for sure what happened the week the line bent.
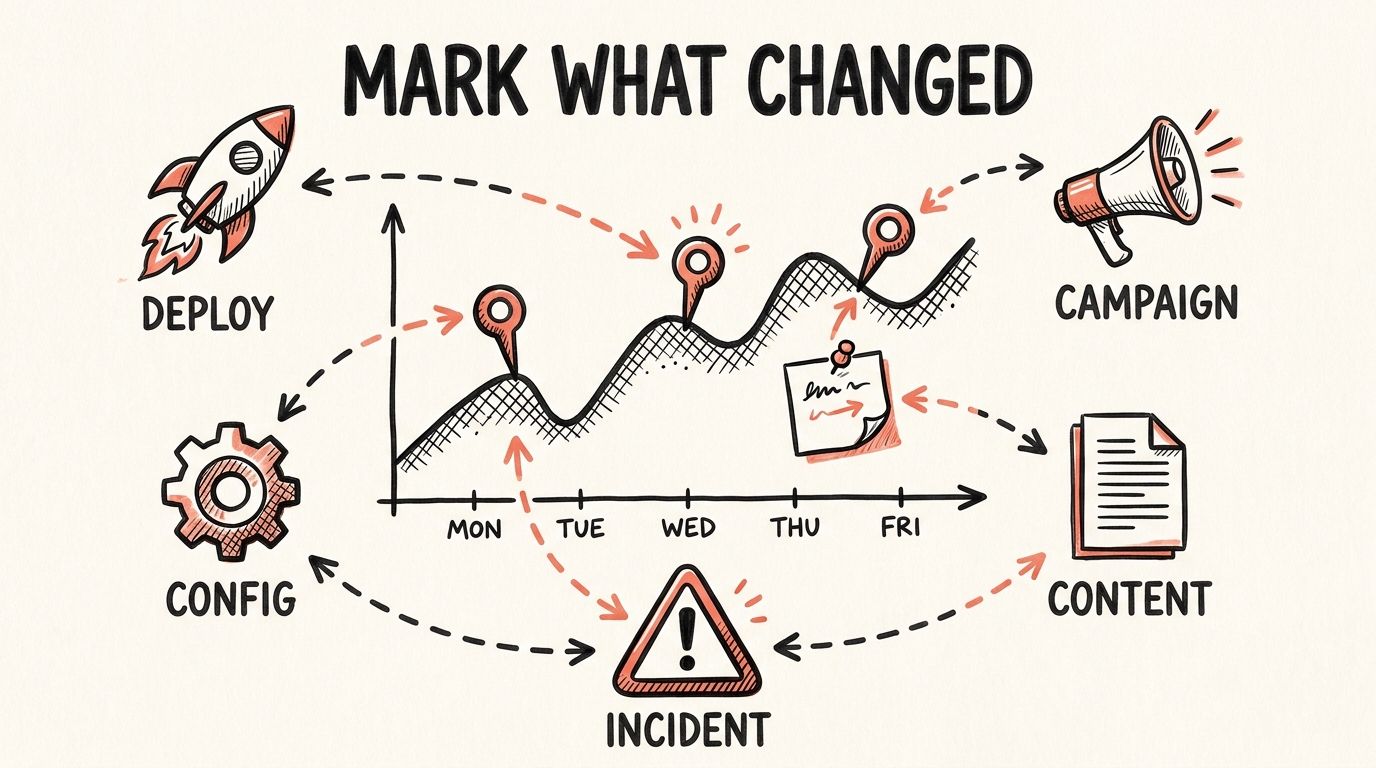
I have spent twenty years on the asking end of that question, in-house and consulting. The teams that answered it in minutes were never the ones with the best analysts. They were the ones that kept a record: one shared place where every change that could move a number gets written down, with a date. Think of it as company hygiene, the same category as backups and a password policy. Dull to maintain, and the cheapest insurance you own the day something breaks.
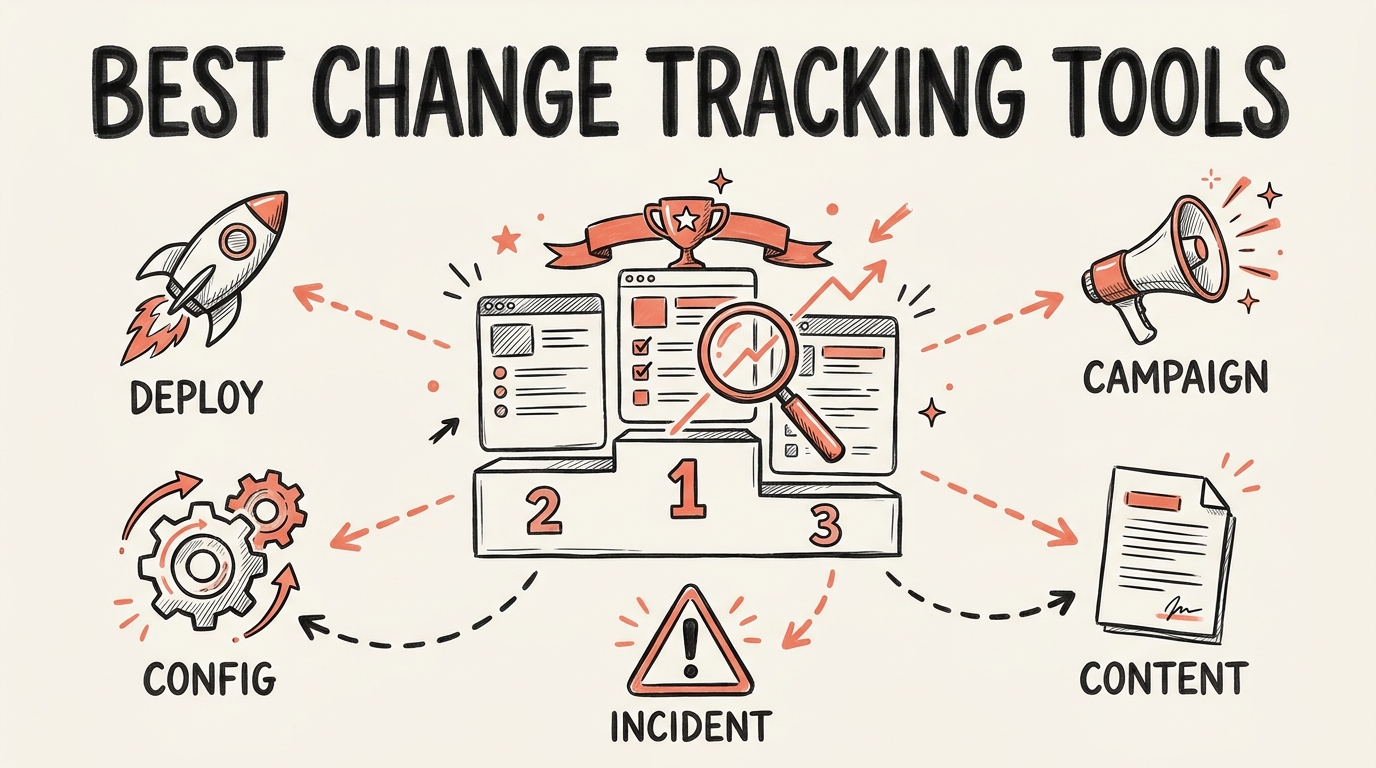
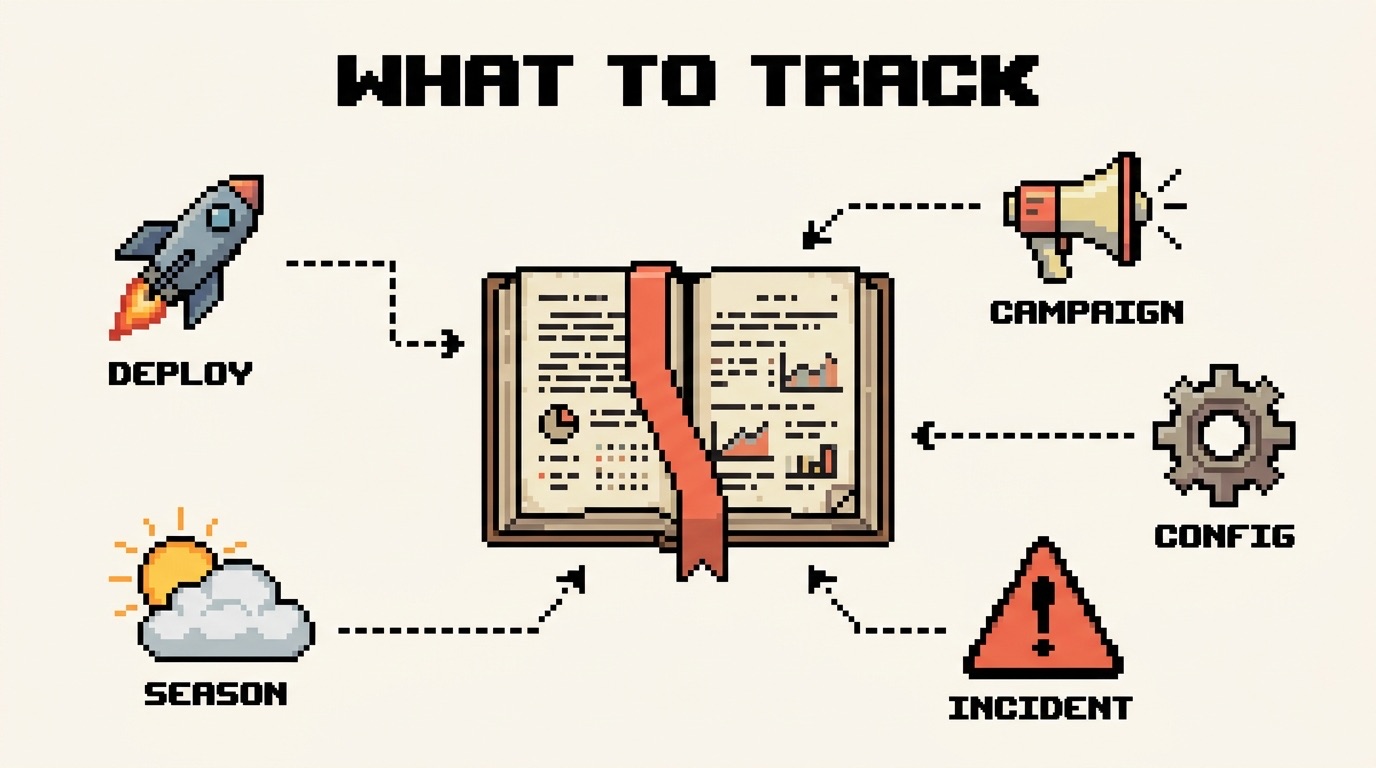
There is an automatic version of this, a company logbook that fills itself from the tools where change happens, and I will come back to it. But the tool is the easy part. The decision that matters is what you choose to track. Get the list right and the record earns its keep. Get it wrong and you have a tidy log that still cannot explain the drop. So here is the list I have built and rebuilt over the years, split into the changes you make and the events that happen to you.
Changes you make
Start here, because your own changes cause the majority of sudden KPI moves. When a number jumps overnight, something your company shipped is the first place to look, and the culprit is usually the least dramatic entry on the list.
| What to log | Why it moves a KPI | Where it lives | Example entry |
|---|---|---|---|
| Deployments and releases | Code that shipped broke or fixed a flow, or changed page speed. The top cause of overnight cliffs. | Your repository and CI | Checkout v3.4 shipped, guest step removed |
| Website and content changes | A new landing page or a rewritten headline can shift conversion within hours. | Your CMS | New homepage layout went live |
| Tracking and configuration | A changed tag, a consent banner, or a referral exclusion can move every KPI at once with nothing real changing. | Tag manager and analytics | Consent banner v2 published in GTM |
| Marketing campaigns | Starts, pauses, and budget changes across email, social, and paid. | Ad platforms, email, social | Black Friday paid campaign paused |
| Pricing and catalog | Price updates, new plans, coupons, and products added or pulled. | Store and billing | Pro plan raised to 49 USD |
| A/B tests and feature flags | Which variant went live, and on which day. | Testing tool and flag system | Pricing test B rolled out to everyone |
| Incidents and downtime | Even a ten-minute checkout failure dents the daily numbers. | Monitoring and status page | Checkout returned 500s for 12 minutes |
| Product launches | New features and products: obvious in launch week, forgotten by the quarterly review. | Release notes | Team plan launched |
The quietest entry on that list is the most dangerous one. A changed tag, a new consent banner, or a referral exclusion can move every KPI at once while nothing real changed at all. Log tracking and configuration changes as carefully as you log deploys. They cause more false alarms than any other node, and they are the ones teams check last.
Events that happen to you
The other half of the story is outside your walls. You did not cause these, but they land in your numbers all the same, and they are the ones teams forget to check, because there is no internal ticket for a heatwave or a Google core update.
| What to log | Why it moves a KPI | Where to source it | Example entry |
|---|---|---|---|
| Search algorithm updates | Core and spam updates explain many organic swings. Log the rollout start and end, not just the announcement. | Search status dashboards | Google March core update finished rolling out |
| Press and brand mentions | A newsletter feature, a viral post, or a podcast spikes brand and direct traffic. | Media and social monitoring | Featured in the Lenny newsletter |
| Holidays and seasonality | Public holidays, school breaks, and Black Friday. Half of all weak-Monday questions end here. | A shared calendar | Public holiday in Germany, our main market |
| Weather | A heatwave or a storm moves demand for commerce, delivery, travel, and local business. | Weather data | Heatwave across the DACH region |
| Competitor moves | Price changes, redesigns, launches, and the big campaigns you can see from outside. | Alerts and manual notes | Main competitor cut prices 20 percent |
| Vendor and platform incidents | Your payment provider or ad platform having a bad day shows up in your numbers, not theirs. | Provider status pages | Stripe degraded for 40 minutes |
| Industry and world events | Trade shows, regulation changes, and news cycles that touch your market. | Manual notes | Industry trade show week |
Look at that last column, the example entries. Every one is a plain, dated line: no syntax, no template, just what changed. That is deliberately the same shape CoNote writes to the timeline when a connected tool logs a change, so the automatic record reads exactly like the notes you would write by hand.
The fifteen nodes in detail
The two tables are the map. This is the territory: each node, what it looks like in real life, and the kind of entry to write down. You do not need to read all fifteen. Skim to the ones your business actually has and skip the rest. Nodes one to eight are changes you make; nine to fifteen are events that happen to you. Where a node lives in a connected tool, an automatic logbook like CoNote records it for you. Where it does not, it is a one-line manual note.
Node 1: Deployments and releases
Your own code is the most common reason a metric moves overnight, and the first thing to check when a line falls off a cliff. A release can break a checkout step, speed up a page, change a form, or quietly remove an element that was carrying half your conversions. The fix that shipped last Tuesday and the drop that started last Tuesday are almost never a coincidence. Log every production deploy and hotfix with the version and what it touched, because "v3.4" on its own will mean nothing to you in three months.
Log it as: "Checkout v3.4 shipped, guest step removed."
Node 2: Website and content changes
Not every change goes through your repository. A marketer swaps a headline, restructures the navigation, or publishes a new landing page, and conversion can move within hours with no engineer involved. These edits are easy to forget precisely because they felt small when they were made. Give a homepage rewrite or a nav change the same weight you give a deploy.
Log it as: "New homepage layout went live."
Node 3: Tracking and configuration changes
This is the node that has burned me more times than any other. A new consent banner, an edited tag, a referral exclusion, or a changed key event can move every KPI at once while nothing about the actual business changed. It is the classic phantom drop: the numbers crater, everyone panics, and the only thing that broke was the measurement. Log these changes carefully, and check this node first whenever a drop looks suspiciously clean across every metric at the same time.
Log it as: "Consent banner v2 published in GTM."
Node 4: Marketing campaigns
Every start, pause, end, and budget change, across email, paid, and social. The big launches are easy to remember. The danger is the small ones. A paused campaign nobody mentioned is the single most common source of a traffic drop that looks unexplainable, because the spend simply stopped and no alarm ever went off. Log the boring pauses as diligently as the exciting launches.
Log it as: "Black Friday paid campaign paused."
Node 5: Pricing and catalog changes
Prices, plans, coupons, and the products you add or pull. These land straight in revenue and conversion, and they are often changed by someone well outside the analytics loop: a founder, a category manager, a merchandiser. A price test or a pulled bestseller can reshape a week of numbers, and the person who made the change rarely thinks to tell the person staring at the dashboard.
Log it as: "Pro plan raised to 49 USD."
Node 6: A/B tests and feature flags
The hard part of experiments is not running them, it is remembering them. Six weeks after a test ends, nobody can say which variant won, on which day it went live, or whether the flag was ever rolled out to everyone. Log the test start, the test end, and the rollout of the winner, so a later shift lines up with the day the change actually reached your whole audience.
Log it as: "Pricing test B rolled out to everyone."
Node 7: Incidents and downtime
Outages, error spikes, slow pages, and maintenance windows all leave a mark, and it does not take a full outage to matter. A checkout that threw 500s for ten minutes during your peak hour can shave a visible amount off the day. Log the incident and its window, because a one-day dip that no deploy or campaign explains is often an hour of trouble nobody thought to connect to the number.
Log it as: "Checkout returned 500s for 12 minutes."
Node 8: Product launches
New features, new products, and the big announcements. These are obvious in launch week, when the whole team is watching, and invisible by the quarterly review, when someone asks why a segment behaves differently and nobody remembers the launch that caused it. Log the date so the before-and-after is anchored to a fact instead of a hunch.
Log it as: "Team plan launched."
Nodes one through eight are things you did. The next seven are things done to you. You will never catch all of them, and you do not need to. The goal is to have the big ones on the record, so they are candidates the day nothing internal explains the move.
Node 9: Search algorithm updates
Google ships core and spam updates that reshape organic traffic for whole industries at once, and they explain a large share of the "our SEO just tanked" panics. Log the rollout start and end, not only the announcement, because an update rolls out over days and the damage tracks the rollout, not the press release. When organic steps down and holds, and no release of yours lines up, this is the node to reach for. It is the same story the organic traffic guide walks through in full.
Log it as: "Google March core update finished rolling out."
Node 10: Press and brand mentions
A newsletter feature, a viral post, a podcast, or a mid-size creator linking to you can spike brand searches and direct traffic in a way your referral report explains poorly. Weeks later, that bump looks like a mystery in the data. Log the mention when it happens, while you still know what caused it.
Log it as: "Featured in the Lenny newsletter."
Node 11: Holidays and seasonality
Public holidays in your core markets, school breaks, paydays, and industry-wide moments like Black Friday. A surprising number of "why is this Monday so weak?" questions end here, with a holiday nobody accounted for in a market that is not their own. A shared calendar of your real markets, not just where the head office sits, saves a lot of dead-end investigations.
Log it as: "Public holiday in Germany, our main market."
Node 12: Weather
For commerce, delivery, travel, and any local business, weather is a real demand lever, not a footnote. A heatwave empties the stores and fills the delivery apps; a storm does the reverse. The trap is that a weather-driven swing looks exactly like a marketing problem, so a team can burn a day auditing campaigns for something the forecast already explained.
Log it as: "Heatwave across the DACH region."
Node 13: Competitor moves
A competitor cutting prices, relaunching a site, shipping a headline feature, or opening a loud campaign can pull on your numbers from the outside. You will not see everything they do, and chasing all of it is a waste. Log the moves big enough to notice, the ones a customer might mention, so a shift in your conversion has an external suspect on the record.
Log it as: "Main competitor cut prices 20 percent."
Node 14: Vendor and platform incidents
Your payment provider, shop platform, ad network, or CDN having a bad day shows up in your numbers, not on your status page. A checkout that fails because a provider is degraded reads as a conversion problem until you learn the cause was upstream. Log vendor incidents from their status pages, because the fault sits in an account you do not control.
Log it as: "Stripe degraded for 40 minutes."
Node 15: Industry and world events
A trade show that pulls your buyers offline, a regulation that changes how you are allowed to market, a news cycle that swallows attention in your category. These are broad and easy to wave away, but the big ones move entire markets. When a shift is too large and too widespread to pin on anything you did, this is often where it lives.
Log it as: "Industry trade show week, buyers offline."
If you can only start with three
Fifteen nodes is the finished state, not the starting line. No team wires all of it up at once, and you should not try. If you are starting from a blank page, track these three first, because they cause the moves that most often look unexplainable:
- Deployments. The top cause of overnight cliffs.
- Tracking and configuration changes. The top cause of drops that never really happened.
- Campaign starts and pauses. The top cause of traffic moving for no reason anyone can name.
Add the rest as you connect each tool. A partial record beats no record, as long as it is honest about what it does not yet cover.
A quick test for what belongs
When you are unsure whether something belongs in the log, use one test. Could this plausibly move a number you report on, and would a colleague reading it six months from now otherwise have no idea it happened? If both are yes, log it. If not, leave it out.
The goal is a record you can trust, not a diary of everything. Over-logging buries the signal as surely as under-logging loses it. A good entry is specific and readable on its own months later: "Checkout v3.4 shipped, removed the guest-checkout step" beats "deploy", every time.
Keep the record without the busywork
A spreadsheet works beautifully on day one. By week three it is stale, because manual logging depends on someone having the discipline to stop and write things down during exactly the weeks, the launches and the incidents, when nobody does. Discipline is the wrong thing to build on.
The version that lasts is automatic. Connect the tools where change already happens, your repository, CMS, tag manager, ad accounts, and monitoring, and let each one write its own entries onto one shared timeline, with readable titles and dates. That is what a change tracking tool does. Then keep manual notes for the short list of things no tool can see: the strategy call, the offline campaign, the price change the CEO made on a Friday.
That split is the whole trick. Machines log what machines know. People log what only people know. Neither side has to remember.
Frequently asked questions
Do we really need to log all fifteen? No. Start with the three above and grow the list as you connect tools. A record that covers your deploys, tracking, and campaigns already answers most of the moves you will investigate. Completeness is a direction to head in, not a prerequisite to start.
Is this not just a changelog or release notes? A changelog covers one team or one tool, usually engineering. A company logbook is the opposite: one record that crosses every team and folds in the outside events too, so a marketer and an engineer read the same timeline when a number moves. Release notes tell you what your code did. The logbook tells you what your whole company, and the world around it, did.
Who owns the log? Ideally no one, because the automatic part fills itself. Ownership is where manual changelogs die: it becomes one person's chore, that person gets busy, and the log goes stale. Wire up the tools so the record does not depend on anyone remembering, then let anyone add a manual note when they make a change a tool cannot see.
How far back does it need to go before it is useful? It compounds, but you do not wait for it. The value lands the first time a KPI moves after you start: instead of reconstructing the week from memory, you open the timeline and read the date. Every week you keep it, the next investigation gets faster.
The habit that answers "what changed?" in minutes
Every fast diagnosis I have seen comes down to one unglamorous habit: writing the change and the date in one shared place, every time. Teams that keep that record close a KPI mystery in minutes. Teams that do not spend two hours digging through Slack and ten admin panels, and often still end up guessing. The list above is what to write down. Do that, and the next time a number moves, the answer is already waiting on the date.
Written by
Stefan Köhn
Founder of CoNote
Stefan has spent twenty years running performance marketing and SEO, both in-house and as a consultant. He has answered the question “why did the KPIs move?” more times than he can count, usually the hard way. CoNote is the tool he wished he had every one of those times.